Ball possession in Dodgeball
TAKE HOME MESSAGES
- Teams eliminate on average .16-.26-.29-.34-.47 players for each possession of 1-2-3-4-5 balls
- Calculating player’s hit percentages for improvised and planned attacks can help identify which players to use for each type of attack
There is a lot of debate regarding what to do when possessing a given number of balls. When in possession of three balls, some teams choose to synchronise two, while others choose to throw one. Which is the better choice in each situation obviously differs between the categories; women’s dodgeball is more reliant on synchronised throws due to their weaker throws, while men more often get away with throwing single balls. In Mixed it depends entirely on the given situation within the set. It isn’t always clear cut which decision is the best one.
One thing most teams seem to agree upon is that the last (fifth) ball should not be thrown, since you are then left with no defensive ball that puts pressure on the opponents, allowing them to have a high line of attack, with free selection of who to throw at. (I have often been criticised for throwing away the last, or second to last, ball. As I will show below, I am no more likely to throw away the last balls than are other players, and given the eliminations expected from the opponents, it can, for some players, make sense to throw the last ball.)
Also, the decision to throw when in possession of a given number of balls is less black and white than people at first assume. As with most tactics, there is no blueprint for success or decision that is always correct in this case. To explain why I will write two posts.
In this first one, I will show the hit percentages for all opponents depending on the number of balls they have in possession. I will also present the hit percentages and number of throws each player made, separated by whether the throw was improvised (decided by the thrower, not the playmaker; usually counter attacks or exchanges) or planned (decided by the playmaker).
In the second post, I will use those figures to show how one can calculate the net expected outcome for each throw. This will allow us to calculate the actual benefit a player brings to the team, as well as whether or not each throw was a good decision, taking expected ball possession of the opponent into account. As you will see, some players are good enough at throwing and deciding when to throw, and at whom, so their expected payoff when throwing the last ball is positive, while others are never expected to break even. In other words, some players should throw the last ball, while others should refrain from throwing as much as possible, and this can be quantified and used to supplement the playmaker’s decision making.
Should we fear our opponents?
The answer to this question is “it depends”. I have recorded every ball that was thrown at the Swedish Mixed Team games during the European Championships 2018 and the Central European Championships 2019. For each attack I recorded the number of resulting eliminations, and the number of balls the opponents had in possession.
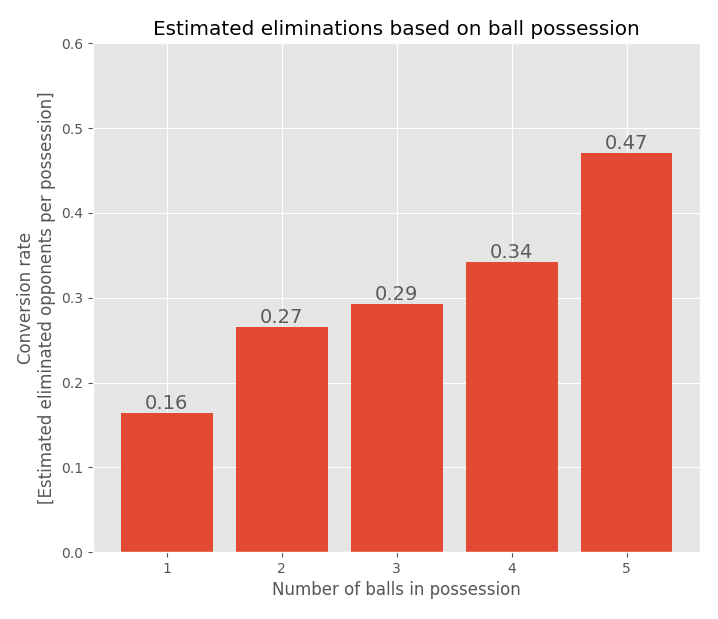
As you can see, whether we should fear our opponents depends on the number of balls they have in possession. When the opponent only had 1 ball, they eliminated players at a rate of 16.4%; far from freezing the blood in our veins. However, when possessing 5 balls, the expected conversion rate rose to 47.1%, either because teams then choose to throw on two players rather than one, or by increasing their chances by throwing 3-4 balls on one player. These values are corrected for the number of expected eliminations, meaning that the actual hit percentage when possessing 5 balls is slightly lower, since some attacks resulted in two eliminations. By calculating the expected conversion rate, one can estimate the expected hit rate one needs to have before deciding to throw away a certain ball.
If my team has only one ball left, and I throw it at my opponents, they will have five balls in possession. Before I throw, I need to know whether my hit percentage in that situation is higher or lower (which will also differ slightly depending on the opponent; read more about that in my post about meta-cognition) than the expected conversion rate for my opponents when they have five. If I am expected to eliminate one player every second time I throw the last ball (hit percentage of 50%), and the opponents are expected to eliminate a total of 0.47 players in each following five-ball attack, then I will have an expected net positive effect of +0.03 eliminated opponents for every time I throw the last ball. Obviously, when throwing the first ball (having five in possession and giving the opponents one), will have a much higher net effect, closer to +0.34 per throw (0.50 - 0.16). The net effect is actually even higher, since one is still in possession of the majority of the balls, and likely to be attacking again, with four balls, implying a net effect closer to +0.50, or above, for that attack.
Should our opponents fear us?
I’ve calculated the hit percentages for the Swedish Mixed Team and our opponents at the CEC2019, together with the number of thrown balls (in parentheses). The values differ from those in the plot above since it used data from both tournaments. As you can see, we are much better at improvising than the opponents we meet (across all possessions), but also much worse at synchronising several balls, particularly when possessing five balls. The fact that we perform better when improvising may explain our success when playing Blitz-Dodgeball (see this post).
Hit percentages and number of balls throws for each ball possession for the Swedish Mixed Team at the Central European Championships 2019
These stats can also be calculated for each individual player. Below I present the hit percentages for all throws, for improvised throws, and for throws during planned attack.


I’ve marked the values according to the number of throws in each box. If a player did not have at least five throws for a given possession, their score is in gray color. This is for easier identification of which values are at least somewhat stable; the more throws that are made, the closer one gets to the true hit percentage for that player.
As expected, the hit percentage for planned attacks is much lower than when improvising. One explanation is that improvised plays often occur when one is closer to the opponent, or when they are not as prepared, such as during counter attacks. Another one is that the playmaker decides which opponent one should throw at, which may not be the opponent one has the highest probability of hitting. A good thrower with fast reflexes may see that an opponent, other than that decided by the playmaker, has jumped or turned their attention elsewhere. Throwing at them instead has higher probability of making a hit. Another conclusion that can be made is that most planned attacks expectedly occur when the teams are possessing 3 or 4 balls.
Using this sort of analysis, one can identify which individuals should be part of each type of attack. As I’ve mentioned in a previous post, I often revise these stats before a tournament. For example, if I am the playmaker and we are attacking with 3 balls, I would not ask Male2, who hits only 10%, to throw with me, but rather Male4 (hits 35%). But, if I instead see the possibility for an improvised counter-attack, and that Male2 has a ball in his hands (hits 50%), I will encourage him to go for the attack and make a throw. I would not do the same for Male3 (hits 15%). This approach to preparation is something I learned when playing quarterback in American football, where you must know both your team-mates and the opponents perfectly, well before the game has started.
In the next post, I will calculate the expected net effect of each throw for all the players, which can help in identification of which players should be encouraged to throw in which situations, and which can be used for further analyses.