My Bachelor thesis in Psychology

About a month ago, I defended my bachelor thesis in psychology (which you can download by clicking HERE or on the image). When I graduated from medical school in 2015 and started preparing for the Swedish medical exam for nostrification, I also took up psychology, which has been an ongoing side project in parallell with my PhD-studies and medical internship.
Since my PhD focuses on autism, on which I have extensive knowledge, I also chose that area for my bachelor thesis. Specifically, one area that has piqued my interest, and which is at the forefront of autism research: subclinical autistic symptoms.
SHORT BACKGROUND ON AUTISM AND ITS SYMPTOMS
Not too long ago, we realised that autism is not an all-or-nothing diagnosis; there are many different presentations and causes (we refer to this as heterogeneity), as well as different intensities (one of the reasons why we use the term autistic spectrum). In other words, one can be more or less autistic. This applies also to those without a diagnosis, where some individuals have few autistic behaviours, and some have many but still do not require a diagnosis.
These autistic behaviours are referred to as autistic-like traits and include
social difficulties - such as reading body language, understanding intentions of others or maintaining small talk
repetitiveness and rigidity - such as difficulty handling new situations and switching between tasks
sensory issues - such as being more or less sensitive than others to sounds, smells, touch, temperature etc.
In addition, there are some
cognitive differences - such as an ability to sustain focus for a long time, understanding how systems work, and being fascinated with numbers.
WHAT WAS THE STUDY ABOUT AND WHY IS IT INTERESTING?
The purpose of the study was to investigate differences in autistic-like traits between sexes, and between students enrolled in technical programs, such as engineering, physics and mathematics, and those enrolled in non-technical programs, such as nursing and social work.
Previous studies have found that males have more autistic-like traits than females, and that higher testosterone levels during pregnancy increase autistic behaviours.
Success in the technical fields requires an interest and ability for understanding and manipulating non-social objects, such as numbers, computers and machines. In contrast, those of the non-technical programs rely heavily on social aptitude. Even though individuals have different ability levels, with some being better than others in many areas, in general there is a trade-off; since the brain has a finite capacity, a strength in one area is associated with a relative deficit in another.
The hypothesis was that technical students have more autistic-like traits than non-technical students, and that males have more traits than females.
I used a questionnaire with 50 questions (the Autism Quotient), that gives a score from 0 to 50, where those with autism usually score above 30, and those without around 14-18.
WHAT were the results?
As expected, the technical students had a 4 point higher average score than the non-technical students. However, additional studies are needed to show the reasons for that difference. One could, for example, compare grades to see if technical students with high scores, and non-technical students with low scores, have better grades.
Interestingly, I did not find any general sex difference. The reason for this is that the female technical students had very high scores. I used cut-off values from previous studies and estimated that roughly 9% of the females in my study would have scores in the same range as those that are otherwise diagnosed with autism, compared to 1% in the general population. I’m not sure why they scored so high, even compared to similar studies on student populations in other countries. For the non-technical students, the males did have an expected higher score than the females though. Since the female technical students are a very specific and small part of the general population of females, I still expect that males have higher scores than females also in Sweden. However, the finding of high autistic-like traits in female technical students is interesting and warrants further studies.

Kernel density estimates of group scores following bootstrapping

Average Autism Quotient scores for the different subgroups
WHAT ELSE DID I FIND?
This part is a bit more technical, so skip it unless you are into autism, psychology, research, or statistics. If you have any questions, or would like to collaborate on some joint project on this topic, let me know.
I also did some additional analyses which were not presented in the thesis, since they were more exploratory, and not building on mainstream findings. I might devote a future post to these analyses.

The left part shows a one-dimensional classification plot with each individual’s LDA-value (score following Linear Discriminant Analysis). The right part shows a Receiver Operator Characteristic curve. EMP = non-technical programs. SYS = technical programs. DOR = Diagnostic Odds Ratio.
One was to use the individual responses of every individual to classify them as either technical or non-technical. The idea was that the pattern of responding for each individual question would differ between the groups. As an example, the question “I am fascinated by numbers” differed so much between the groups that one could tell which study program they were enrolled in with around 70% accuracy based on that question alone. When using all the questions, the classification accuracy was 98.9% (using something called Linear Discriminant Analysis. However, this is without cross validation, so the figure is to be taken with a grain of salt). Compared with using just the total score for the questionnaire, this way includes much more information about the participants, so one can expect a higher accuracy. I might make this analysis public on the website, as a fun thing to do. Then one could do the questionnaire and get a score (an LDA value, left part of plot) that tells you how much your cognitive profile fits that of either study program.
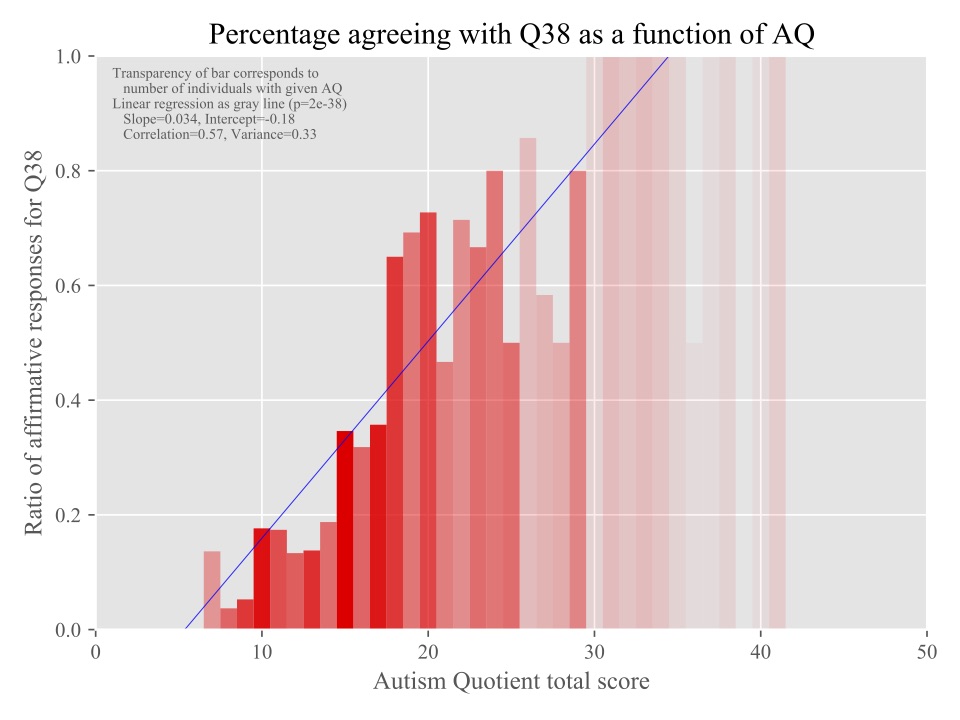
Another thing was to develop a method for comparing how good each question is at testing autistic-like traits (with something called conditional density plots). This is partly because I’m interested in developing a questionnaire of my own, which is more specific for the subclinical autistic-like traits. These plots can be used to both guide development of new, and tweaking of existing questions, and for the development of an improved scoring system, which could be more sensitive and normally distributed than the one currently in use. As I was writing this post I thought of, developed, and tested such a system, with alternate weighting of questions. This improved diagnostic classification accuracy for autism by 1% (when using a classification method that I developed and presented at a conference in Montreal in May 2019), and increased group separation (p-value for my case-control cohort AQ scores went from 0.00002 to 0.0000001) even when the weighting scheme was developed using a separate sample (weighting developed from students in my bachelor thesis, and tested on the case-control cohort from my PhD project), indicating robustness of the results.